API Dashboard
Use the API dashboard to inspect your API requests and the webhooks sent to you.
See also troubleshooting for debugging help.
Get started at https://logs.legalesign.com.
Use the login credentials for your API key-holding account.
Layout
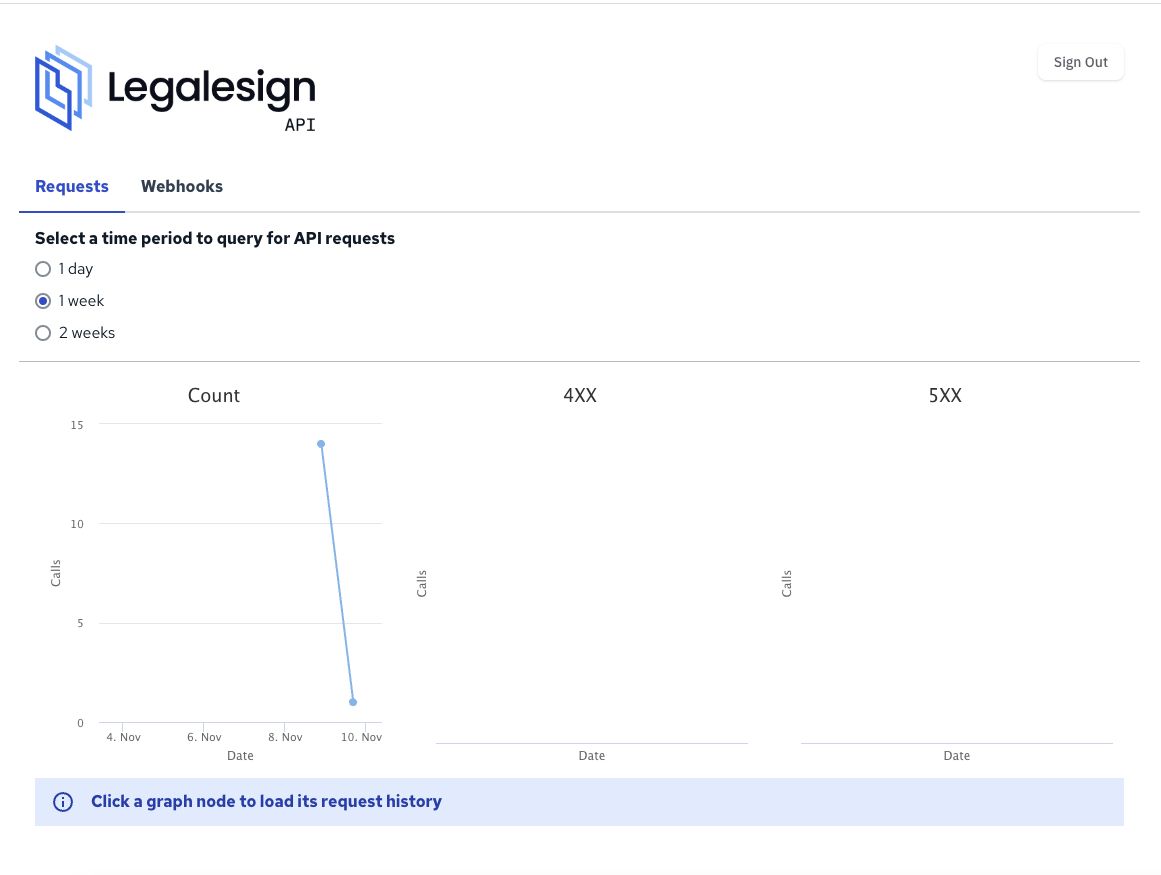
The image below shows the dashboard after login. There are three tabs, request log, webhook log, and config. In Requests, click one of the time period buttons to show API requests over the last day, week or fortnight. In this example there are no recent api requests.

Time graphs & requests
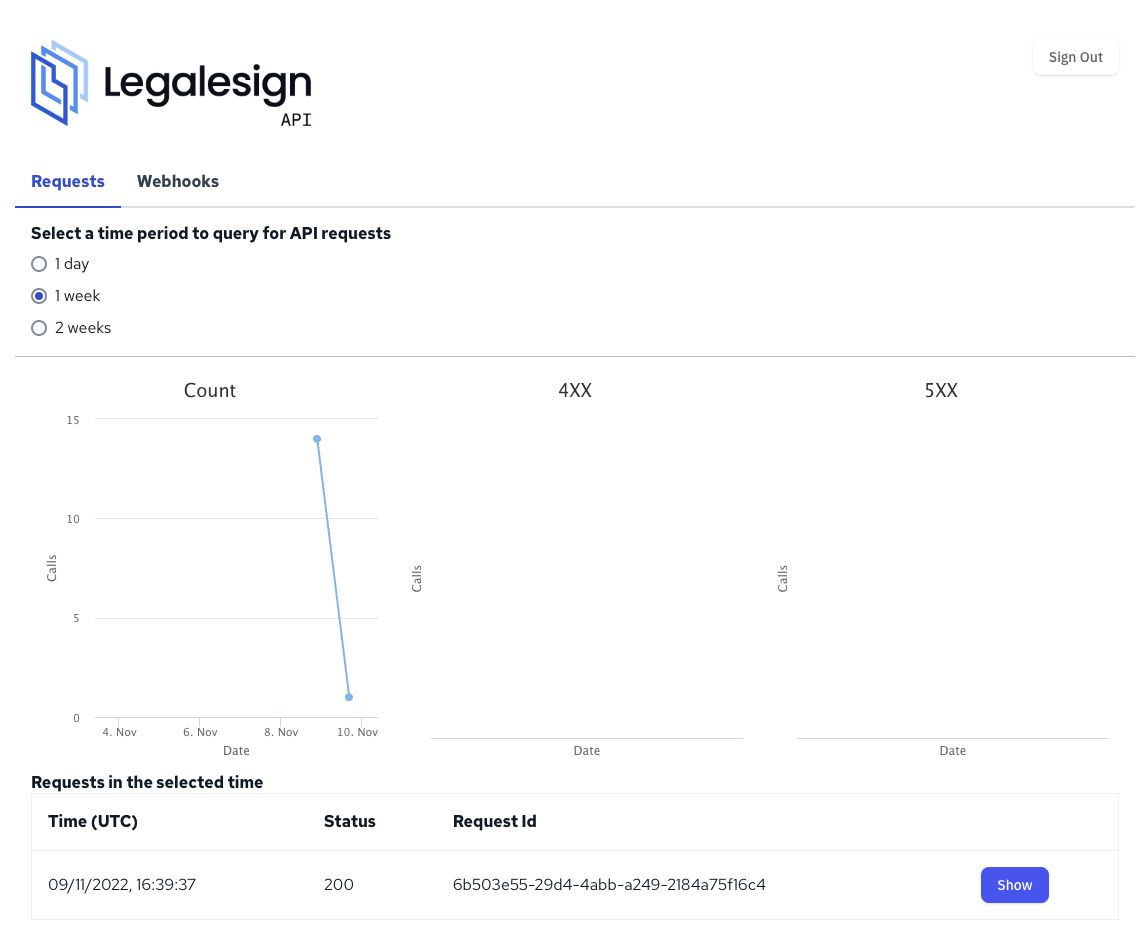
After you click a time period your requests will be graphed. In the image below, the graphs show API requests over the last week.
The graphs, from the left, show the overall count of requests then filtered by 4XX and 5XX status.
Review the image below. This account made 14 requests two days ago and one yesterday. There are no 4XX or 5XX requests over the last week.
Click a graph node to list requests at that time. In this case, clicking the right hand node shows the 1 request (in the table below the graphs) with its datetime and http status.
Note the dashboard is not realtime. Your latest API requests may take a minute or so to arrive.
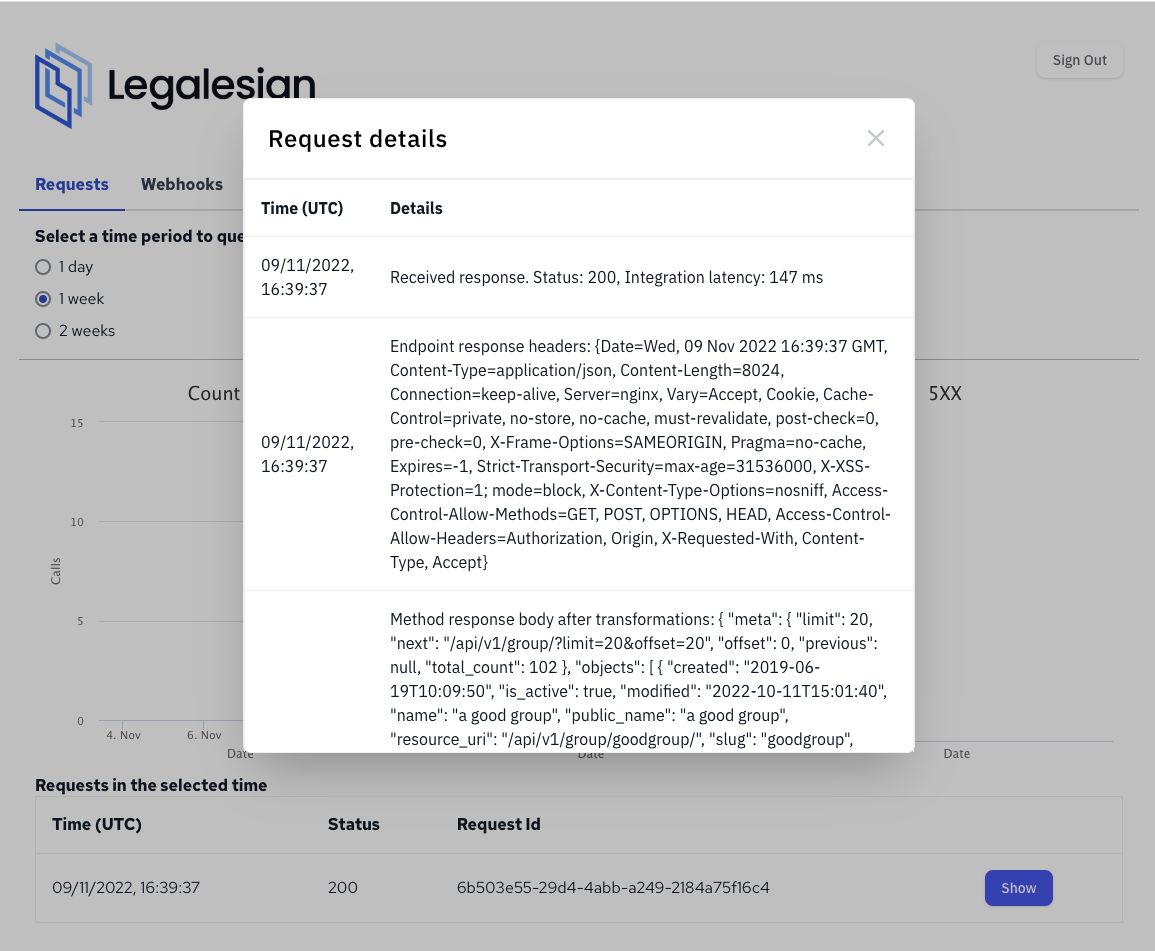
To dig into the details of a request click the 'Show' button. All the logged details pop up in a scrollable modal.
Webhooks
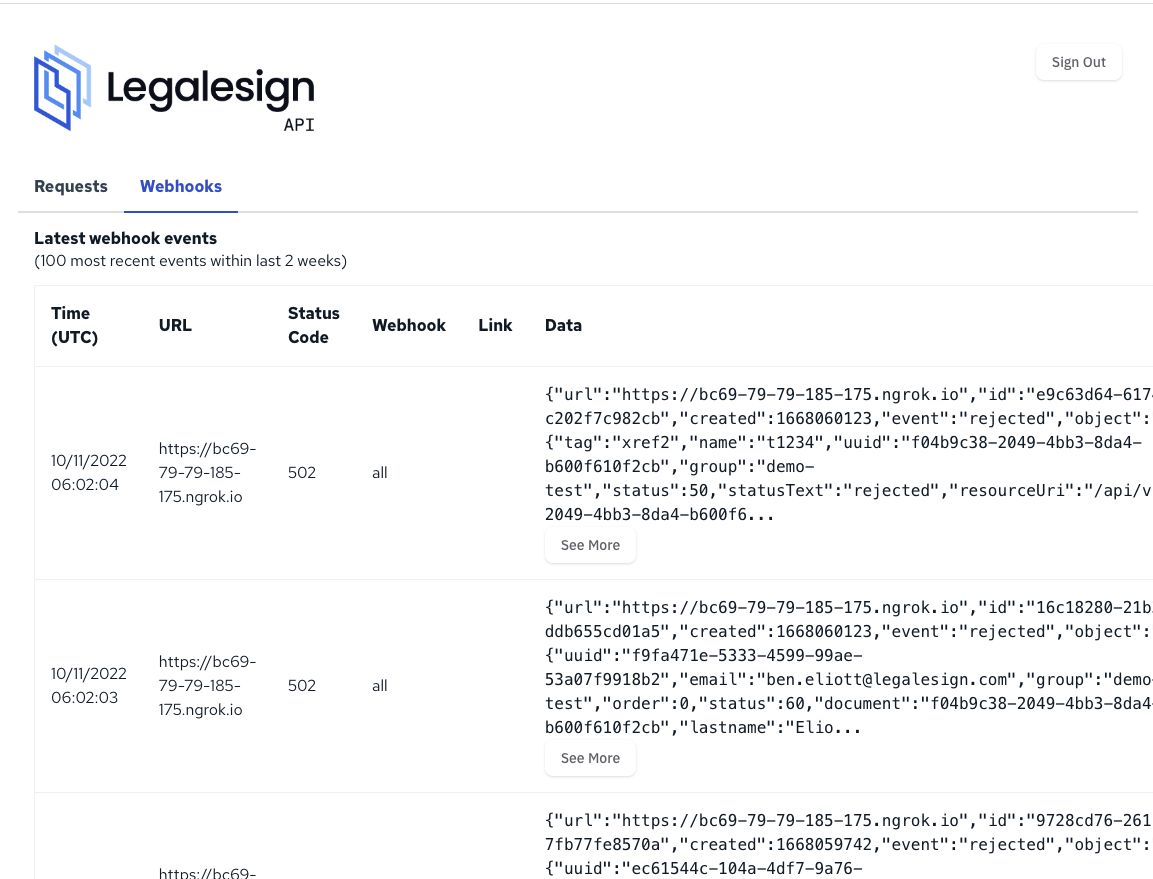
Click the webhooks tab. Webhooks sent over the last hour are shown automatically. Otherwise fill out the search form to query by day and hour.
The table lists the http status we received back from your endpoint and all the data sent.
The screenshot below shows several 'all realtime' webhooks being sent to an ngrok address.
Common webhook issues
403 status - this is most likely your site cross-site request forgery (CSRF) protection. Since a webhook is a POST request you'll need to turn this off for the receiving view.
5XX statuses - your parsing is most likely going wrong. Run the JSON data shown through your code to check it parses as expected.
Config
The Config tab tells you whether you are in sandbox or production mode, contains your API key, a list of development groups, and webhooks.
You can update your API Key and add or remove webhooks. To move to production mode, or to change your development groups, create a support ticket.
The start of the Config tab includes some quickstart python code with your API key. You can use the API Documentation to get ready-to-paste code in most languages.

The second half of the page shows development groups and webhooks:

Enjoy! If you have any queries about the API or API Dashboard we look forward to hearing from you - support.legalesign.com.
Don't forget you must have 2FA on your account for the API dashboard to work. Here's that dashboard link again - logs.legalesign.com.